
Enhancing simulation studies with 3D animation
Thursday, 09 February, 2012
The use of simulation studies to better understand the dynamic behaviour of a system under investigation is at the core of verifying designs early in the development process. Despite the amount of data that such studies produce, a 3D representation of the system creates a more complete understanding of system behaviour.
This article describes the use of 3D animation in simulation-centric workflows to augment early verification activities, such as those used in model-based design.
The evolution of technology and domain specialisation in the simulation and 3D graphics fields presents several challenges to using 3D animation in simulation-centric studies. A set of examples illustrates how to meet these challenges.
The last decade has seen the increasing use of computer technology to prototype engineering designs before hardware manufacture or deployment. One area that has generated significant interest is the study of dynamic systems in which nonlinear equations determine the governing dynamics.
Providing the means of representing these systems as software programs enables multiple simulations to be run, based on various inputs to the system. This methodology presents opportunities for the simulation engineer, such as the ability to vary system parameters or environmental inputs to reflect possible-use scenarios and to do so exhaustively.
Early verification through simulations minimises the risk inherent in the design process by reducing the probability of discovering errors late in the development process.
Effective early verification requires the careful analysis of simulation data to enable understanding of system behaviour.
For example, an engineer could analyse data sets to discover patterns of unintended behaviours that resulted during multiple runs. The analysis of such data, however, can pose a challenge as it creates the need for domain-specific experts who decipher it.
What makes the understanding of simulation data from a dynamic system difficult? Typically, it is the interdependencies in the multidimensional data caused by the equations describing the system.
In addition to the mathematical analyses that can be done on raw data, visual representations of the data such as 2D and 3D plots for cluster or trend analysis would enrich our understanding of the data relationships due to their placement relative to each other or with respect to a parameter, such as time.
Despite the obvious advantages of using the analytic and visual methods together, this approach would provide some challenges to our understanding in specific situations, especially when the dimensionality of the data is large.
Consider the simple physics of an aircraft whose physics modelled a rigid body having six degrees of freedom (6DoF). To analyse the motion of this aircraft, the dimension of the data in time would be six, representing three positional and three rotational coordinates.
Besides the obvious limitations in deciphering trends in the raw data, graphical representations such as 2D and 3D plots will be insufficient to improve our understanding of the rigid body motion in this six-dimensional data space.
The task becomes harder if we add dimensional complexity to this example by measuring temperature data in time as a function of surface geometry.
Much has been written on 3D graphics about a picture being worth a thousand words. Some authors have ambitiously extrapolated that moving images are worth even more. Over the decades, the success of the 3D video game industry and advances in 3D graphics hardware and software lend credibility to this observation.
But from a simulation-centric standpoint, data representation using 3D scene representations is promising, if the system under study has interesting interdependencies that can be perceived by the analyst.
For example, a 3D animation of multiple agents collaborating to achieve a common or different goal would provide insights in the area of swarm studies.
In general, dynamic simulations with their associated physics, such as mechanics, thermodynamics, acoustics or multibody interaction, present opportunities for visualisation through 3D animation.
A combined strategy that uses these approaches can enhance early verification. Figure 1 shows an example of vehicle dynamics simulation in Simulink as a hybrid representation that combines the three approaches.
The dimensionality of the data associated with this simulation is 78 - mechanical parameters of the four wheels (64) each consisting of positions (three), rotations of wheel axis (nine), spin (one) and forces (three). The remaining (14) are associated with the braking signal (one), steering input signal (one), car position (three) and car rotation (nine).
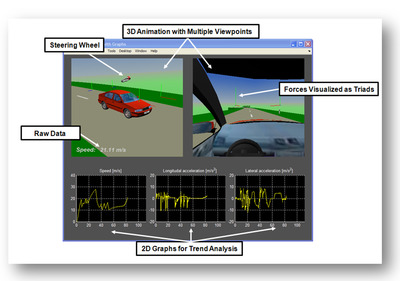
Figure 2 shows examples of simulation performed in the Simulink modelling environment with Simulink 3D Animation for 3D modelling in virtual reality modelling language (VRML). Engineers can use these 3D animation techniques in the early verification process.
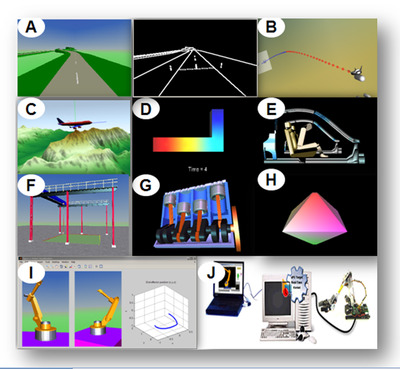
As shown in Figure 2 (A), testing the algorithm for a lane departure system in this computer vision application would require the capture of several input videos, which can be costly to acquire and difficult to determine in the initial stages of the project.
After building the test environment virtually, these input videos can be acquired by recording the motion of a camera through this world and then preprocessing them.
As shown in Figure 2 (B), by viewing the trajectory tracing of a spacecraft from different viewpoints, a visual notion of the shape characteristics is obtained.
The trajectory is initially coloured blue and then changes to red due to the transitioning between different system operating modes.
While a state chart animation enables the understanding of the transition between the modes as a function of time, this methodology provides an additional lens by viewing this information in 3D mathematical space. In the later stages of the design, trajectories can be compared by overlaying the simulation and experimental data.
As shown in Figure 2 (C), the environment model consists of 3D terrain data of a city visualised for understanding aircraft travel.
In Figure 2 (D), the heat distribution data obtained from a finite element analysis on a solid metallic block is visualised through color dynamics.
As shown in Figure 2 (E), in situations that require multiple tests on a model where a subset of those encounter failure, then 3D animation can help visualise the nature of the fault, as shown in the crash-test visualisation.
As shown in Figure 2 (F), in this dynamic simulation of a portal crane that has been programmed to follow the positional input command, the test engineer can specify the 3D position of the object to be lifted as a test vector for the simulation. The test vector is then mapped to the 3D visual coordinates, providing creative opportunities during interactive testing.
In Figure 2 (G), this shows the motion of the coupled four-cylinders inside an internal combustion engine.
The visualisation of the motion of the crank, connecting rods and pistons helps to understand the timing of the entire system. 3D graphic technologies also enable objects to be rendered transparently, thus enabling the appearance of other objects within them.
In Figure 2 (H), this figure shows the morphing of a 3D polyhedral object whose vertices and their associated motion signals appear and disappear in time, which helps understanding of systems where the dimensionality in the input test vector to a system varies in time.
Figure 2 (I), shows simulation that has had details abstracted out such that only a couple of parameters are required for tuning. This abstraction can be used to visually verify and quickly reach the answers.
In Figure 2 (J) is an example of rapid prototyping with 3D animation. A 3D animation containing the plant in tandem with the actual view of the hardware provides insight into the differences between the behaviour in simulation and the actual implementation.
By using these 3D animation techniques, engineers can overcome the challenges of understanding complex data or sharing information with stakeholders who may not be interested in the technical details of the solutions.
The mapping of data in the software model to visual coordinates provides an effective means for understanding and sharing information across teams within an organisation. From a marketing standpoint, a recorded animation of a proposed solution is convincing to customers or project sponsors.
Despite the advantages of using 3D animation in early verification of designs, several technological challenges exist for the simulation engineer. The fields of computer 3D graphics and engineering simulation have evolved differently, with important consequences.
Increasing specialisation has led to widely divergent skill sets and has affected the growth and development of technology and tools in the two fields. Figure 3 shows the range of possible applications by plotting 3D graphics fidelity against simulation fidelity.
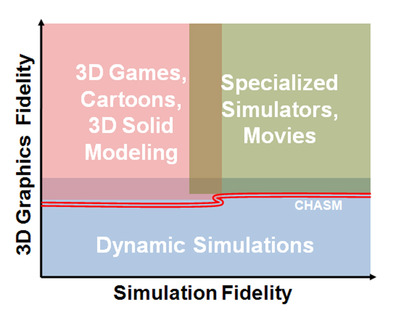
The economic cost of any application that brings these domains together depends on the fidelities of the simulation and the 3D models.
For example, a large-scale 3D flight simulator project requires domain experts such as graphic designers and engineers, as well as computing hardware.
The result is the creation of a highly specialised application that meets user needs but is not easy to customise (Figure 3, top right). A range of applications such as solid modelling and cartoon animation (Figure 3, top left) are not simulation-intensive, but depend on high-quality graphics.
But what about dynamic simulation projects on an engineer’s desktop that may not require high-fidelity 3D graphics (Figure 3, bottom)? Engineers use 2D graphics to visualise the data in their simulations and face the challenge of trying to build compelling 3D animations to run on top of their simulations.
This challenge is represented by the chasm shown in Figure 3. Engineers must cross the chasm for simulation studies to be more effective.
From a simulation engineer's standpoint, to cross this chasm will require that the tools and technologies must enable the following:
- Complexity management of 3D world authoring including portability across different computing platforms;
- Seamless connectivity from the simulation environment including 3D rendering;
- Lower cost to the individual user to contain project costs.
The plethora of proprietary 3D authoring tools presents a challenge to simulation engineers who want to import the tools into a simulation environment. Open standards for 3D scene authoring enable engineers to build, share and connect to the tools across simulation environments.
VRML, a standard accepted by the International Organisation for Standards (ISO), has evolved to the emerging XML-based standard called X3D. The language contains sufficient intuitive 3D constructs that can be used to author 3D scenes.
As an example, Simulink 3D Animation provides connectivity to drive 3D worlds authored in VRML from Simulink, thus enabling easy collaboration across different computing platforms. Choosing an open 3D standard also encourages vendors of proprietary tools to support them.
Over the last several years, the 3D authoring tools segment has been fiercely competitive as several free and inexpensive tools have emerged and gained popularity. Some examples of these tools are grouped below according to their use in the simulation environment.
3D VRML/X3D editors: An advantage of standardising on an open standard such as VRML/X3D is the availability of free or inexpensive tools for authoring. Simulation engineers who want to author or modify existing 3D models in VRML can use these editors:
- V-Realm Builder;
- Flux Studio;
- Internet Scene Assembler;
- SwirlX3D;
- VrmlPad.
3D non-VRML editors: Non-VRML editors are usually powerful and designed for specific 3D modelling tasks. Most have a rich set of examples that engineers can use for simulations.
Legacy 3D work in these environments, such as CAD models, can be re-used. These tools are generally expensive and complex, but some are relatively inexpensive or free. Examples include:
- 3ds Max;
- AC3D;
- Autodesk Maya;
- Blender;
- CATIA;
- Google SketchUp;
- LightWave;
- modo;
- Pro/ENGINEER;
- SolidWorks.
The following editors support a VRML/X3D-export feature. Engineers can define precision and complexity of the exported tessellated files to meet performance requirements. Specialised model conversion and optimisation tools offer polygon reduction and model optimisation capabilities. Examples include:
- PolyTrans;
- Deep Exploration;
- VizUp.
3D authoring tools that facilitate model creation in highly specialised application areas such as terrain generation, urban modelling, laser scanning and reverse 3D engineering usually combine connectivity to external data sources with the ability to automatically create 3D models. Examples include:
- 3DEM;
- World Construction Set/Scene Express;
- FARO Laser Scanner software tools.
3D content on the web: Market competition in the online 3D content segment has made the acquisition of 3D elements from a vendor for assembly inside a VRML editor very affordable and free in many cases. Popular sites that have emerged in recent years for acquiring such content are:
- www.turbosquid.com;
- www.amazing3d.com/;
- www.3dexport.com;
- www.the3dstudio.com;
- www.3d02.com;
- www.top3d.net/;
- sketchup.google.com/3dwarehouse.
The simulation tool must provide connectivity and features that support 3D animation. The following examples show different kinds of 3D animation support that are available within the Simulink environment, as shown in Figure 4.
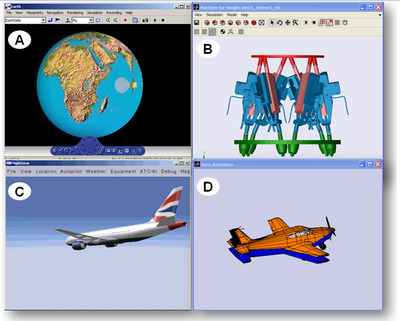
Figure 4 (A). Direct connectivity to 3D VRML worlds with Simulink 3D Animation: This product contains blocks that enable the connectivity of Simulink signals to their 3D counterpart. A high-quality animation viewer it brings animation into the simulation environment. Figure 4 (B). Automatic CAD model import into SimMechanics models: This CAD model for a Stewart platform was imported automatically with built-in animation into the Simulink environment as SimMechanics blocks.
The model is useful for the visualisation of mechanical parts modelled in CAD. Multiple parts can be combined to form a scene using the VRML-export approach.
Figure 4 (C). Direct connectivity to FlightGear simulator project is an open-source, multiplatform, cooperative flight simulator development project. It is a flight simulator framework for visualising flight simulation.
Aerospace Blockset provides blocks that can be used to plug data from simulations within the Simulink environment into this simulator. Figure 4 (D). Direct connectivity to MATLAB Handle Graphics: Most simulation tools will have simple 3D geometrical primitives that can be used to author simple 3D objects. This figure shows the overlay of flight simulation and actual trajectory data for a simple aircraft created with Handle Graphics in MATLAB.
Ricoh chooses u-blox module for long-lasting GNSS performance
The Ricoh Theta X camera incorporates the ZOE-M8B GNSS module from u-blox, allowing users to...
Single-step 3D printing method to create tiny robots
The breakthrough enables the mechanical and electronic systems needed to operate a robot to be...
Fast inspection technique for modern semiconductor devices
Researchers developed a novel approach to inspect and measure critical dimensions of...


")
